Meet them where they are. How mobile research gets you closer to consumers.

woman sharing consumer insights

We’ve all felt the shift.

The economy, largely driven by consumer spending, has impacted buying behavior.

As research professionals, that’s exactly what we study. Change. We rely on consumers to tell us what they’re thinking, how they’re buying, and why they’re making certain decisions.

Our jobs depend on the insights we receive. So, what do we do when the climate in which our consumer buy, changes?

We change too.

Using mobile research.

In 2017, a research crisis was declared1.

People were concerned. The most common ways to collect insights, weren’t working the way that they used to. Specifically, there were issues with:

  1. Door-to-door surveys: Expensive, intrusive2
  2. Paper and pen surveys: Slow, and hard to review3
  3. Telephone surveys: Less than 6% answer4
  4. Online surveys: Only 49% of respondents were satisfied5

Enter mobile research.

Today, a whopping 81% of the U.S. owns a smartphone6. And they spend more than three hours a day on their phones. That’s an easy-to-reach, collective and representative audience.

The idea behind mobile research is to use smartphones to reach consumers. It isn’t tied down by in-person interviews, landlines, or hardline computers. It moves with the people you study. As such, it eliminates virtually all the issues that our industry is used to, addressed above.

Case Study: Cell phone carrier.

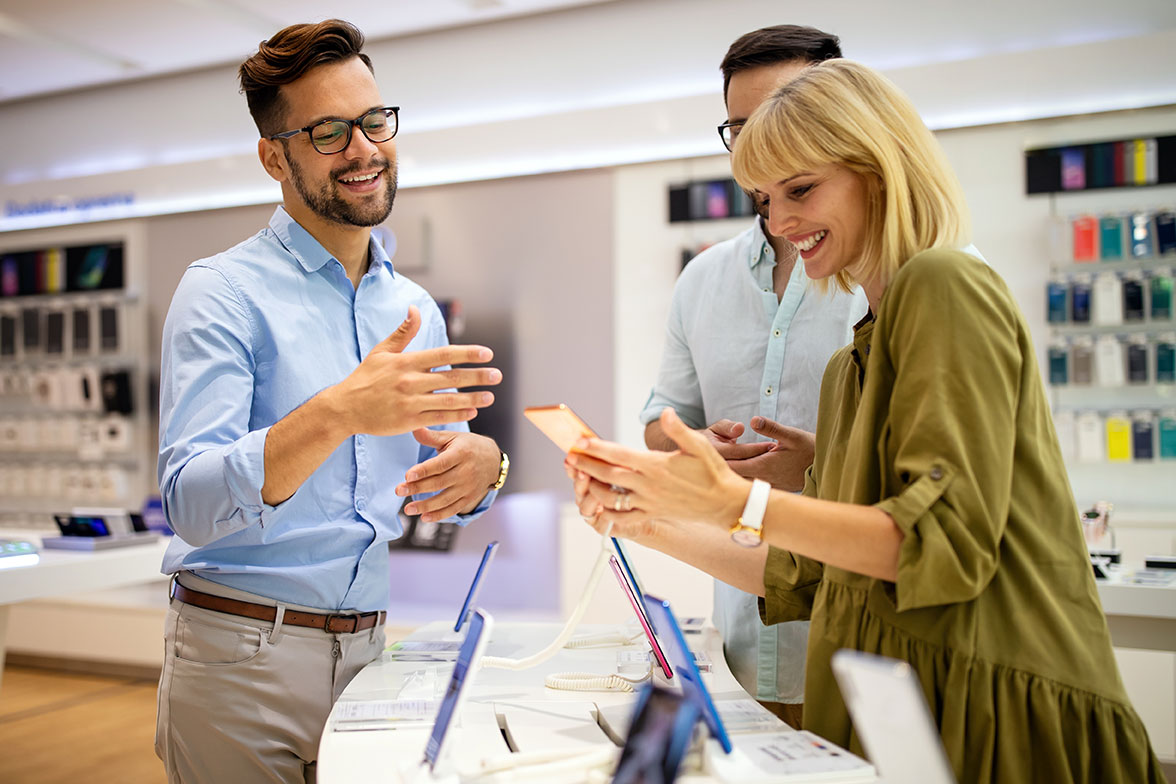
A major cellphone brand was in a tough scenario.

They were tracking consumers to their stores, but struggling to get a complete picture of the people likely to buy their brand. Specifically, they couldn’t get an accurate sample of:

  • Males
  • Young people
  • Hispanic Americans

Using any of the four methods above.

Missing a majority of their target market meant a higher incidence rating, and higher costs. It also meant that they had to ask detailed questions to identify the make, model and carrier of people they could reach. Collectively, their challenges limited the accuracy of the research.

Here’s how they solved the problem: They switched to a mobile research tracker. Like a typical brand tracker, this research continued to follow their consumers. Yet, now they had the ability to open up the panel to 81% of the U.S. population who owns a smartphone.

This meant that the brand could now access 10 million daily consumer journeys via a market research app. They were able to meet their target market needs, find out exactly what make, model and carrier participants had – without asking – and increase their incidence rating.

With a mobile app, they are also tracking online and app behavior.

How mobile research works:

Here’s how mobile market research works, in detail. And the three things you need to make it work for your research projects.

  1. Identify the need.
  2. Pick your audience.
  3. Add behavioral data.

We’ll take a look at each one, together, to get you comfortable with the platform as a whole.

#1: Identify the need.

Any good research project starts with a goal in mind.

Mobile research is no different. It’s simply a weapon of choice, focused on acquiring accurate data and insights. So, you’ll start in the same way you always do, with a simple question:

What is the goal of this study?

With that in mind, you can craft a compelling questionnaire (QRE) alone, or with a research provider. Either way, your questioning should be designed to meet that primary goal.

Example: COVID-19 need.

In the wake of COVID-19, consumer spending shifted.

In order to understand the impact, we decided to research buying behavior. The goal was to track the purchases of essential, versus non-essential, items at big-box retailers.

We expected the virus to reduce non-essential spending. On the other hand, we expected food and toiletries would increase, as consumers prepared for a possible quarantine. Not wanting to rely on the questionnaire alone, we chose to leverage behavioral data as well.

We’ll share more about behavioral research, which is unique to mobile, in section 3.

#2: Pick your audience.

In mobile research, your audience lives in an app.

That app is how you connect with consumers’ smartphones. When consumers download the app, they’re sent a survey, asking for their demographic data.

Example demographics include:

  1. Age
  2. Income
  3. Ethnicity
  4. Relationship status
  5. And more than 200+ other pieces of data

All of their data points are stored in the app. This gives you, the researcher, a great degree of flexibility to profile your ideal target audience. You choose exactly who to include as a panelist.

Example: COVID-19 panel.

We needed men and women 18+.

The app gave us 1,133 participants: split 48% male, 52% female. The primary age was 18-44 years old. Participants were screened on knowledge of Coronavirus and a retailer visit within 30 days. Stated data was collected with a 13-question survey via the Surveys On The Go® app.

We fielded and collected data in as little as two hours. The speed with which you can conduct mobile research is powerful. Full projects can be completed within a 24-hour period.

Here are examples of the stated behaviors they shared.

Stated Behaviors on High-Traffic Visits.
Stated Behaviors on Social Interaction.

Figure 1 & 2: percent change was used to calculate increase/decrease from February to March waves.

We see that consumers stocking up for a quarantine.

This shows in increased purchases in hand sanitizer (80%), household supplies (65%), nonperishable foods (49%), and face masks (35%). Generally, respondents are preparing for 2 to 4 weeks, which explains the buying shift at big box retailers, where they can buy in bulk.

#3: Add behavioral data.

The real difference in mobile research: behavioral data.

Behavior-driven research is the ability to see what consumers do, rather than rely on stated data alone. The reason it’s so important is that it eliminates fraud and recall bias in one step7.

Consumers can’t remember everything. So, if we only ask them to state their behavior, and they can’t really remember what they did, it puts the entire project at risk for being inaccurate8.

Mobile research has a solution.

Here, the research is being done on an app.

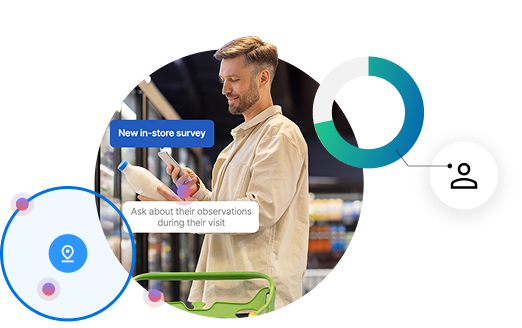
That app is connected to GPS on the smartphone. When a consumer moves, the app knows it. And the app can now send a survey to that consumer in real-time, right as they’re walking into (or out of) a location, interacting with an app, or doing an online activity.

That’s behavioral research.

Example: COVID-19 behavioral data.

Here’s an example of behavioral research with COVID-19.

We tracked total visits to Walmart, Target, Sam’s Club and Costco.

Each participant was GeoValidated through GPS using the Surveys On The Go® app. A visit was defined as going a listed retailer from January 1st,  2020 to March 4th, 2020. Visits were tracked week over week.

Here’s their behavioral data.

Tracked Visits to Big Box Retailers

Figure 3: percent change was used to calculate increase/decrease from week over week from 1/1 through 2/26.

Stated and behavioral data, together, shows us a massive shift in consumer spending.

Once COVID-19 was declared a pandemic9 there was up to a 32% lift in visits to big-box retailers. When combined with the stated data, we’re given a very detailed picture. Consumers are very clearly preparing for a potential quarantine.

They’re looking to buy essentials in bulk. 

Impact of Coronavirus In-Store: Increased Purchases.

At the same time, in-store purchases decreased in home décor (31%) and clothes (32%).

We’d expect consumers to decrease non-essential in-store spend as they focus on food and supplies, if they believe they’re about to quarantine. 

Impact of Coronavirus In-Store: Decreased Purchases.

What’s interesting, is that we still see non-essentials being bought. Consumers are just buying them online, instead of in-store. There’s a 46% increase. We see this in Figure 5 below.

Impact of Coronavirus Online Purchases.

Hearing, and seeing consumer behavior – in one place – is powerful.

Stated surveys allow us to tap into the voice of the customer, but behavioral data gives the credence we need to be sure our research picture is accurate. This is only possible with mobile research, which has the technology to paint the full picture for researchers in the field.

Final thoughts.

Market research is personal.

We’re in the business of working with real people. And we need to get even more personal if we want to improve the result of our research. It’s not enough to base important business decisions on guessing who consumers are, what they want, or why they want it.

To do that, we need to be talking to real people in real-time.

That’s what mobile research does. And that’s why is forging a new union between behavioral and survey data. You now have the power to track real consumers historically and in real-time.

Mobile research brings big data, consumer journeys, and survey data: into one.

It’s a single home for reaching a representative, first-party consumer panel. The result is more powerful than any tool we’ve had before. It’s consumer understanding based on reality. And we’re excited to see our industry continue to expand, and benefit from, the latest technology.

References:

  1. https://3905270.fs1.hubspotusercontent-na1.net/hubfs/3905270/ebook/P2P_eBook_2018_FINAL_print.pdf
  2. Corey & Freeman, 1990; Taylor, Wilson, & Wakefield, 1998
  3. Peter Ward Taralyn Clark Ramon Zabriskie, 2014
  4. https://www.politico.com/story/2019/02/27/phone-polling-crisis-1191637
  5. https://go.mfour.com/hubfs/ebook/P2P_eBook_2018_FINAL_print.pdf
  6. https://mfour.com/wp-content/uploads/2020/03/How-to-Predict-Future-Behavior-and-Impact-Revenue-Guide.pdf?utm_source=hs_email&utm_medium=email&_hsenc=p2ANqtz-_hk7DDSUuhjnH-aDfP-hnglZDUyMUIeEUr13sXC78yAVezW6XTVoYpffVu2p0NYzz4wzCH
  7. https://mfour.com/wp-content/uploads/2020/03/How-to-Predict-Future-Behavior-and-Impact-Revenue-Guide.pdf?utm_source=hs_email&utm_medium=email&_hsenc=p2ANqtz–pkXkynKZZOGnpcNMS9Xb4Setr_lnsbufV8knul76gpy7NXRGhibH5uXHcubNrwJ2XTg29
  8. https://go.mfour.com/blog/flawed-recall-means-fractured-data-use-geolocation-to-solve-memory-decay
  9. https://www.cnbc.com/2020/03/10/dow-futures-point-to-a-loss-of-more-than-400-points-after-tuesdays-surge.html

Posted on May 6th, 2020

Explore More Posts

Stay in Touch

Stay up to date on consumer trends by opting into our newsletter.